

Configuration Via Web Configurator
Interface Overview
After authorization, you will see the main dashboard.
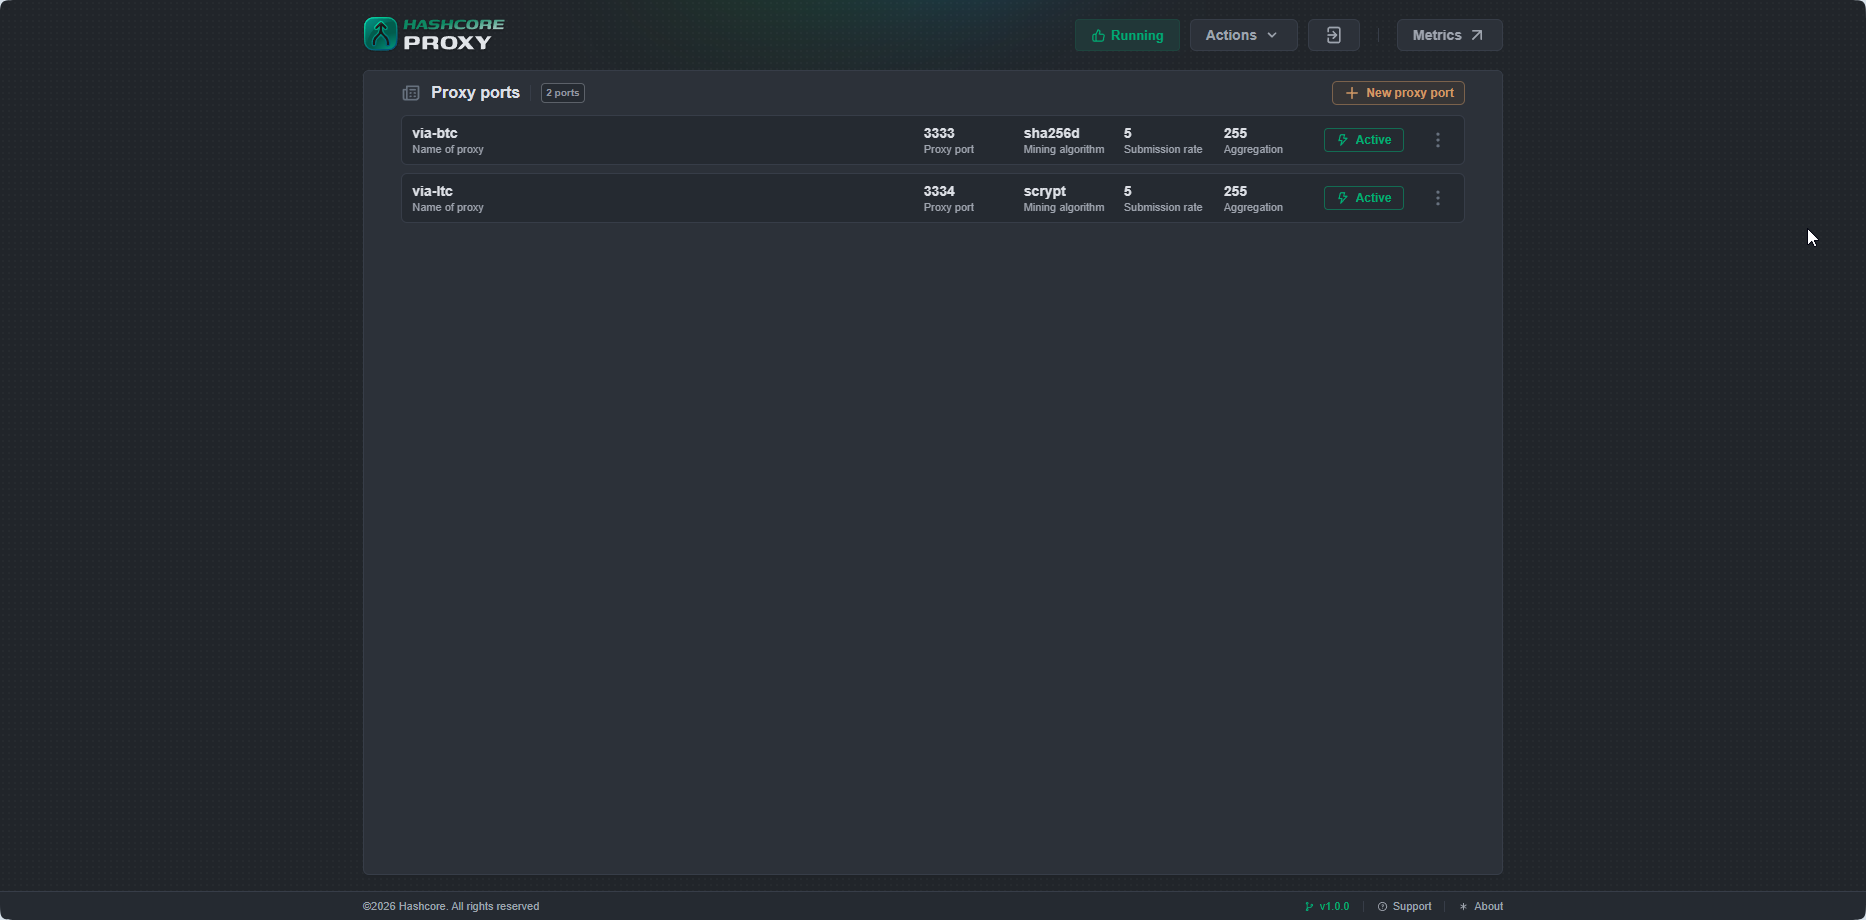
Top Panel

The top panel contains:
- Status Indicator: Current status of the proxy service:
- Running: The proxy service is operating normally.
- Stopped: The proxy service is stopped.
- Restarting: The proxy service is in the process of restarting.
- Failed: The proxy service terminated with an error.
- Unknown: Status is unknown (no connection to the service).
- Actions Menu:
- Get diag report: Generates a diagnostic report for technical support.
- Restart proxy: Restarts the proxy service.
- Stop proxy: Stops the proxy service.
- Metrics: Navigates to the Grafana monitoring dashboard.
- Logout button
Main Area — Proxy Ports List
The Proxy ports section displays a list of configured ports. For each port, the following is indicated:
- Name: Port name
- Proxy port: Port number for miner connections
- Mining algorithm: Mining algorithm
- Submission rate: Share submission frequency
- Aggregation: Number of miners per connection to the pool
- Status
- Active**:** The port is active, accepting connections
- Inactive:**** The port is disabled
Port management menu (three dots on the right ⋮):
- Enable: Enable or disable the port
- Edit: Open port settings
- Delete: Delete the port