

Grafana Dashboard
You can access Grafana directly from the web configurator by clicking the Metrics button in the top panel, or by opening http://localhost:5000 in your browser.
Filters
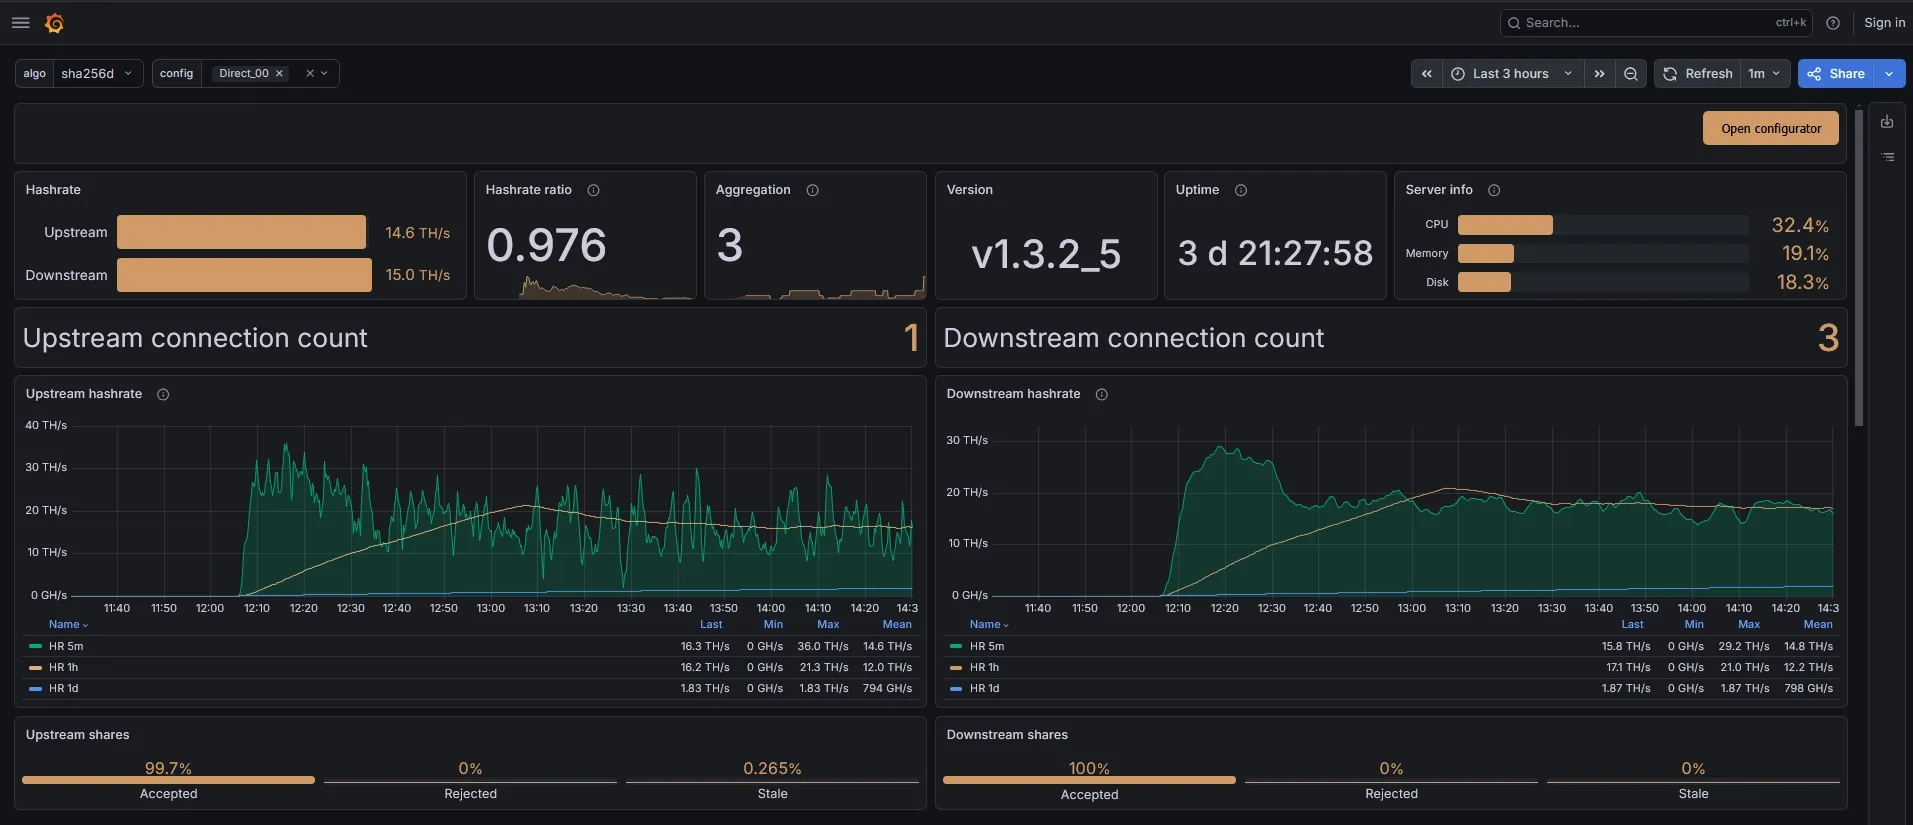
The following filters are available at the top of the dashboard:
- algo — mining algorithm (
sha256d,scrypt). - config — proxy port name (corresponds to the Name field in the web configurator, e.g.,
Direct_00). You can select one or more ports simultaneously. - Time range — the displayed time interval.
- Refresh — data refresh rate.
TheOpen configuratorbutton in the top right corner opens the web configurator in a new tab.
Key Metrics
- Downstream Hashrate. Hashrate received by HashCore Proxy from miners.
- Upstream Hashrate. Hashrate transmitted by HashCore Proxy to mining pools.
- Hashrate ratio. The ratio of Upstream Hashrate to Downstream Hashrate.
A value close to 1.0 is considered normal.
If the indicator is consistently below 1.0, some shares may be rejected or lost. In such a case, it is recommended to check for rejected and stale shares, as well as the quality of the connection to the pools.
- Aggregation ratio. The actual aggregation level — the average number of miners served by a single connection to the pool.
This value reflects the actual load on upstream connections and may differ from the Aggregation parameter specified in the port settings.
For example, if 3 miners are connected and one connection to the pool is used, the Aggregation Ratio will be 3. If Aggregation = 30 is configured, it means that the current aggregation level is significantly lower than the maximum possible for this port.
When the number of miners changes dynamically, the Aggregation Ratio value may decrease because some upstream connections remain active even after the load decreases.
- Version. The current version of the Stratum Proxy component.
- Uptime. The continuous operation time of the proxy without restarting.
- Server info. Server system resource usage:
- CPU load;
- RAM usage;
- network metrics.
- Upstream / Downstream connection count. Number of active connections:
- Downstream — between miners and the proxy;
- Upstream — between the proxy and pools.
- Upstream hashrate / Downstream hashrate graphs. Hashrate dynamics over time. Three averaged values are displayed in the legend below each graph:
- HR 5m — average over the last 5 minutes.
- HR 1h — average over the last hour.
- HR 1d — average over the last 24 hours.
For each metric, the table shows Last, Min, Max, Mean values for the selected period.
- Upstream / Downstream shares. Share processing statistics:
- Accepted — successfully accepted shares.
- Rejected — rejected shares. Reasons may include:
- incorrect difficulty;
- data transmission errors;
- issues on the pool side.
- Stale — stale shares. These shares were found by the miner but arrived at the pool after a job change and do not contribute to reward calculation.
Advanced Statistics (Advanced)
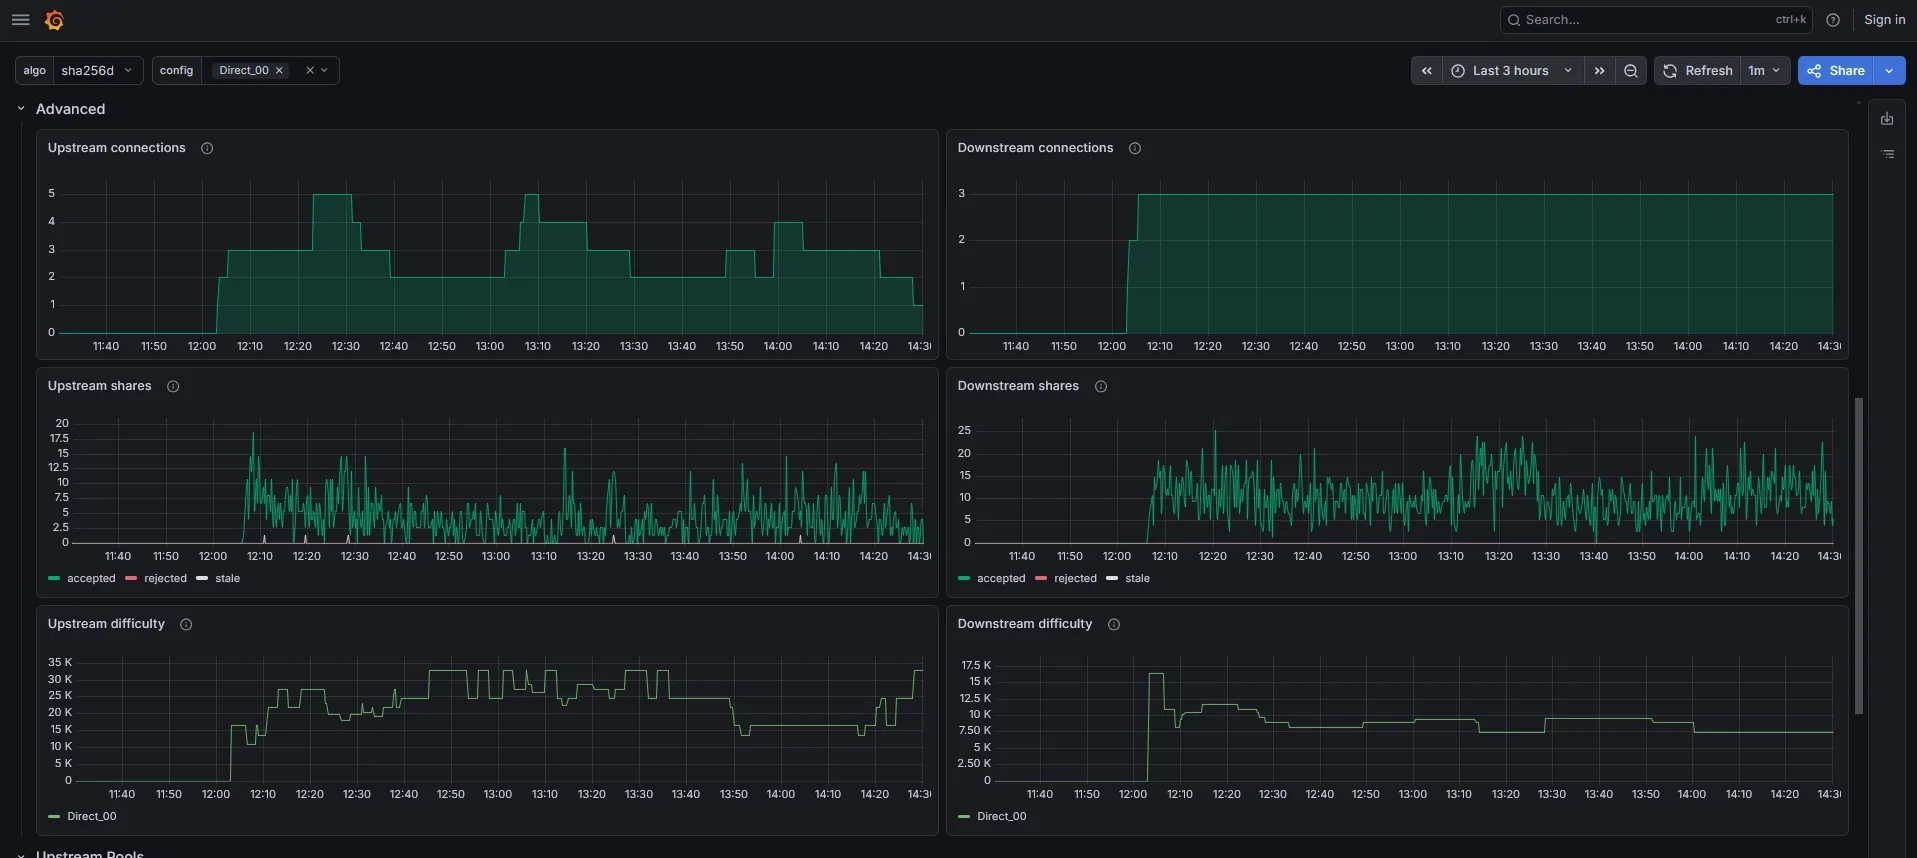
The Advanced section is located below the key metrics on the same dashboard. It contains detailed graphs:
- Upstream / Downstream connections. Detailed connection statistics between miners, proxy, and pools.
- Upstream / Downstream shares. Detailed statistics of sent and received shares.
- Upstream / Downstream difficulty. Current share difficulty:
- Downstream — on the miners' side;
- Upstream — on the pools' side.
Pool Status (Upstream Pools)
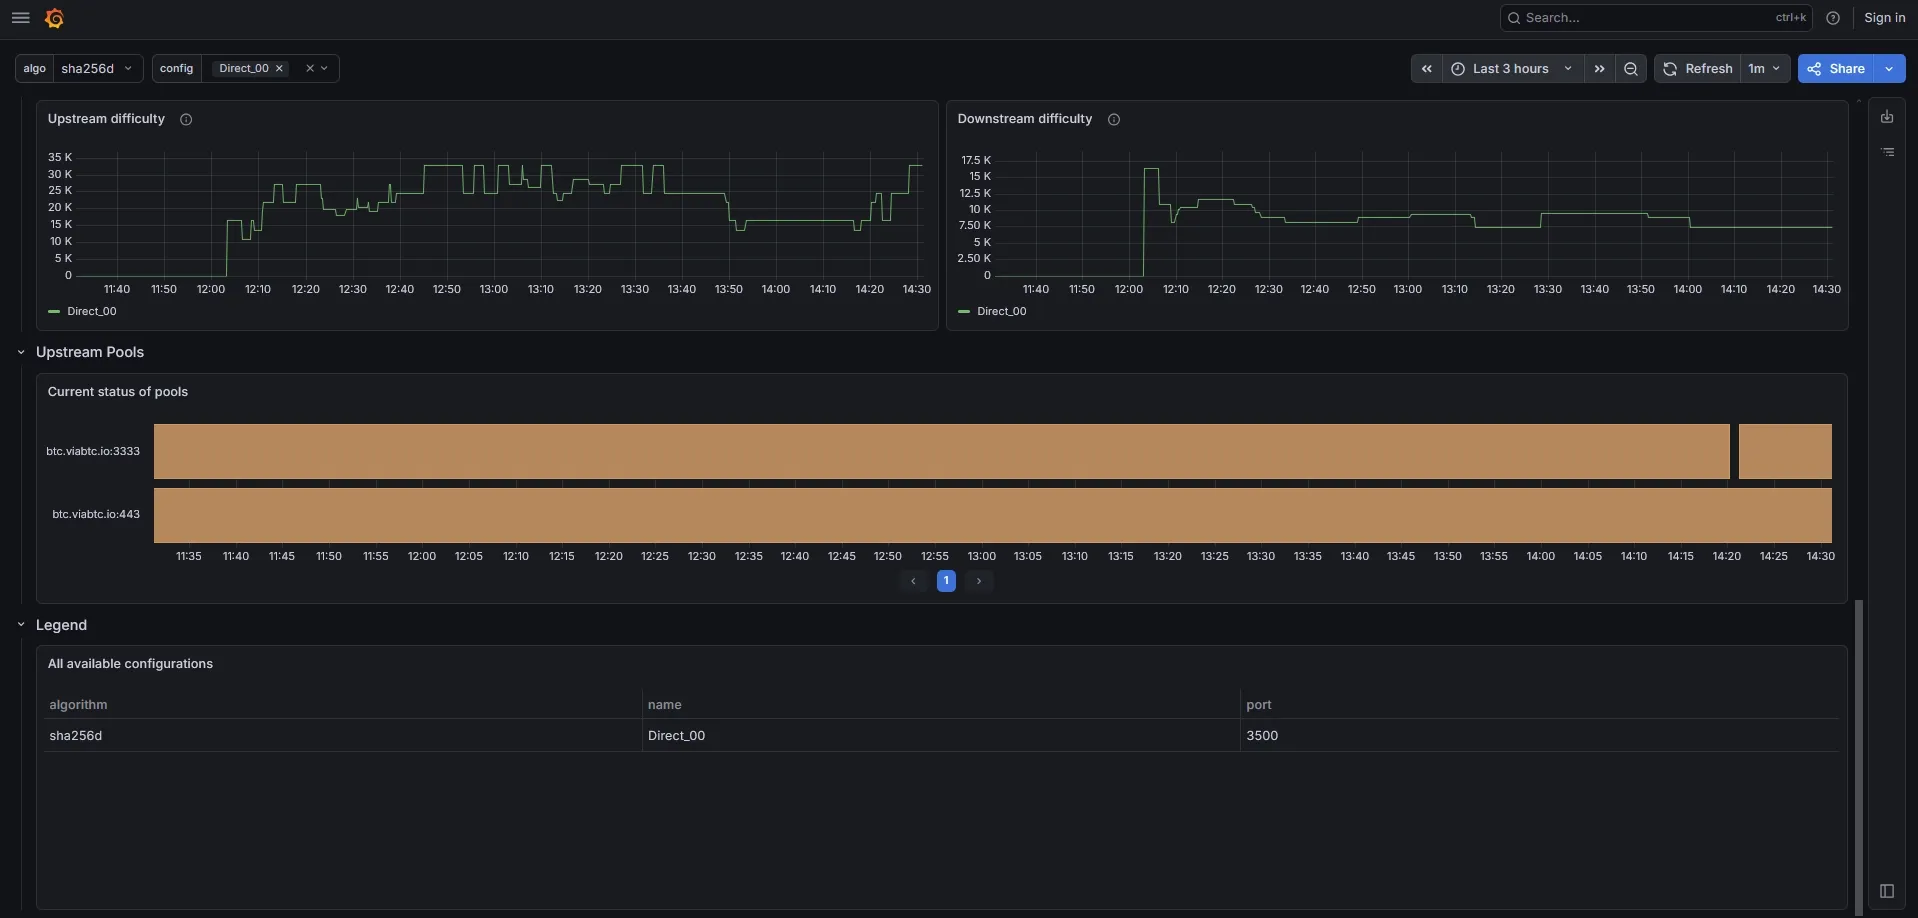
The Upstream Pools section displays a timeline of activity for each configured pool over the selected period. It shows when each pool was active.
The graph allows you to monitor:
- pool availability;
- connection stability;
- brief connection interruptions.
Configuration Legend (Legend)
The Legend section at the bottom of the dashboard contains the All available configurations table — a list of all configured proxy ports with their algorithm, name, and port number. This is useful when working with multiple ports, allowing you to match the config filter value with actual settings.
Setting up your own Prometheus
HashCore Proxy provides metrics in the standard Prometheus format. If you already have your own Prometheus server deployed in your infrastructure, add HashCore Proxy as a data source, specifying the target:
Additional Dashboards
The following dashboards are available in the Dashboards menu: